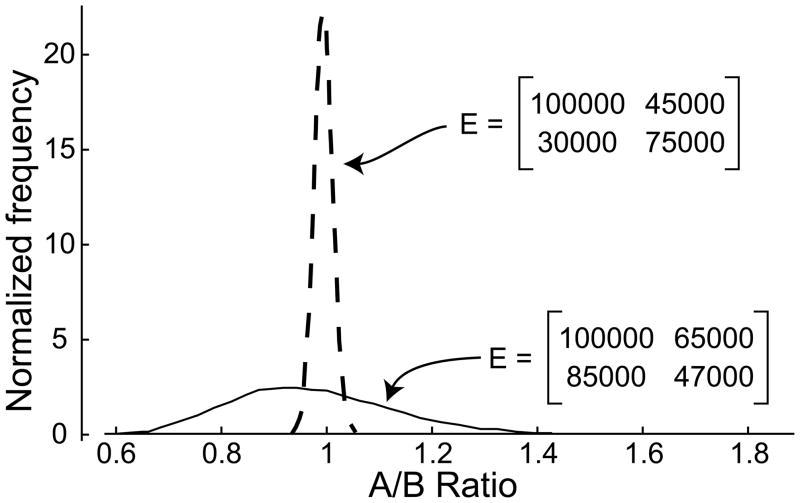
Figure 1. Linear decomposition of optical signals with noise.
To demonstrate the effects of noise on decomposition of absorbance signals into concentrations, we calculated the ratio of two components found when 5 μM of each component was converted to absorbance signal using the indicated extinction-coefficient matrices (E, indicated in panel) using Eq. 8. Synthetic, normally distributed noise with a standard deviation of 0.003 was added, and the process reversed to produce concentrations again. These concentrations were converted to an A-over-B ratio. Shown are histograms of results when the process was repeated 10,000 times each for the two different E matrices. The histograms were normalized to give an area of 1.

