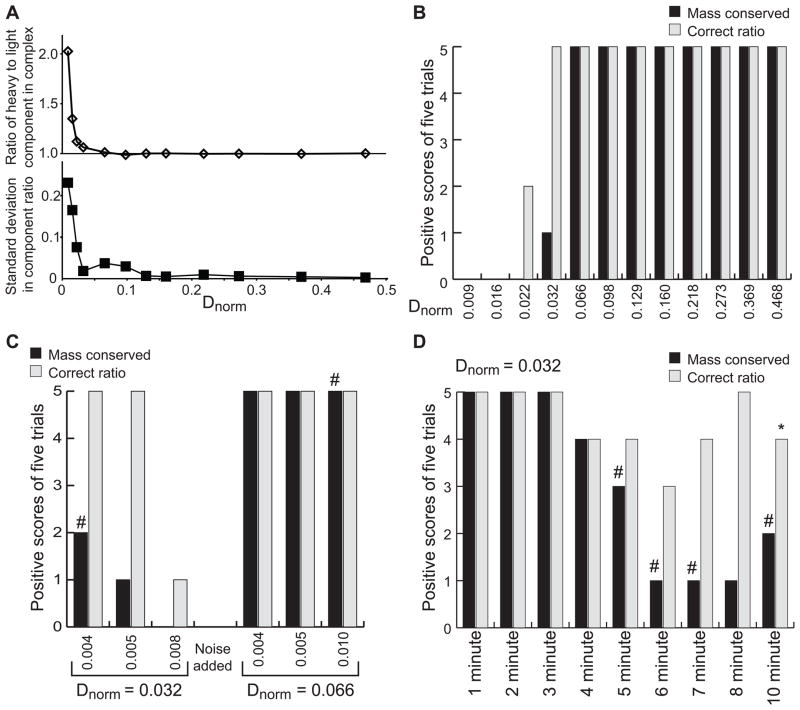
Figure 2. Effects of Dnorm on MSSV analysis.
Results from fitting simulated hetero-association MSSV data. (A) Using common conditions, a single signal increment was varied to produce systems with the indicated range of Dnorm values. Simulations were repeated five times with distinct synthetic noise added (optical signal noise of 0.005 rmsd) for each system. (A) ratio of the two components present in the integrated complex sedimentation peak in ck(s) analysis (9.2 S peak). The average ratio (top) and standard deviation (bottom) for the each set of five repeats are shown. (B) Assessment of the fitting results in (A) by qualitative scoring. Conservation of mass was scored by integrating the entire ck(s) distribution for both components and comparing to the input component concentration. Integrated concentrations between 90% and 110% are scored as positive. Complex component ratios were compared to the expected value (1) and those between 0.9 and 1.1 were scored as a positive result. Bars show the number of positive results from five trials for conservation of mass (black bars) and ratio (gray bars). (C and D) Summary of simulated MSSV analysis similar to that in panel B, but for Dnorm of 0.032 or 0.066 at different noise levels (C) or for Dnorm of 0.032 and different acquisition frequencies (D). A pound symbol, #, indicates one analysis with more than 15% spectral contamination. The asterisk indicates the one example of an analysis which found the conservation of mass to be satisfied, spectral contamination acceptable, but the component ratio in the complex to be outside of the range of 0.9 – 1.1. In this case, conservation of mass was only barely satisfied 90.01 % of the light component was found, but the ratio determined was 1.13.

