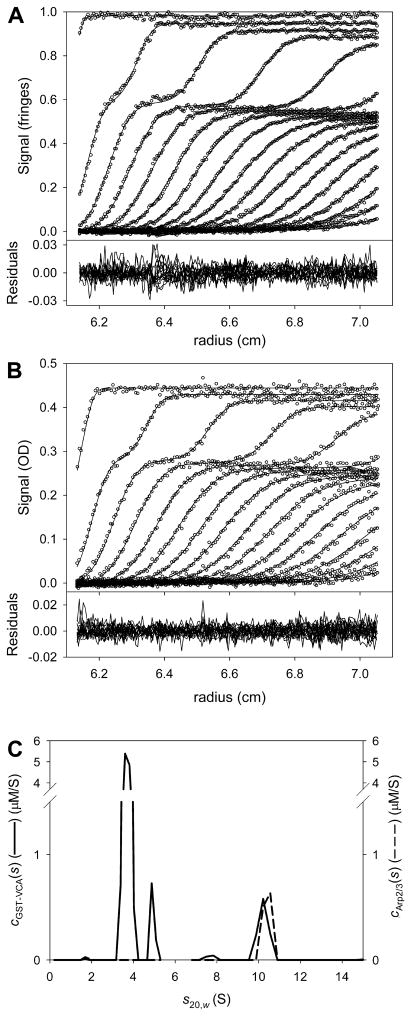
Figure 6. Multisignal fit for the mixture of GST-VCA and Arp2/3.
(A) The data, fit, and residuals for the IF data. (B) The data, fit and residuals for the A280 data. Panels (A) and (B) show only every sixth scan, as 101 scans were fit in this analysis. (C) The two distributions used to model the data in parts A and B. The solid line is the cGST-VCA(s) distribution, and the dashed line is the cArp2/3(s) distribution. Note the cosedimentation at ~ 10.4 S. An integration of the peak at 10.4 S yields the concentration of the cosedimenting components. They are approximately equimolar (see text).

