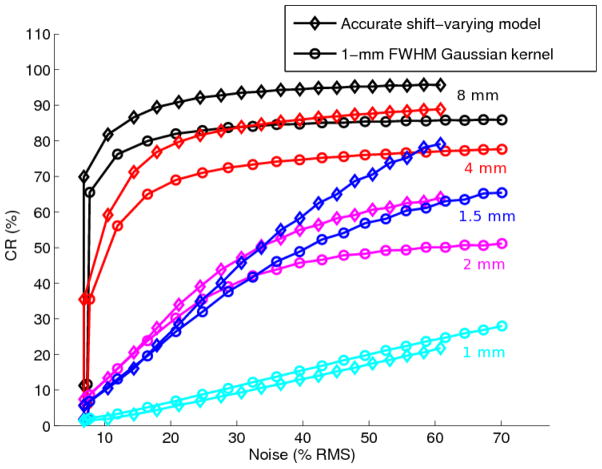
Figure 11.
Contrast recovery (CR) plotted as a function of noise for varying iteration numbers (datapoints) and sphere sizes. The curves are shown for the five sphere sizes (black: 8mm, red: 4 mm, magenta: 2 mm, blue: 1.5 mm, and cyan: 1 mm) and for two types of reconstruction: accurate projection model (diamond) or shift-invariant Gaussian model (circle).

