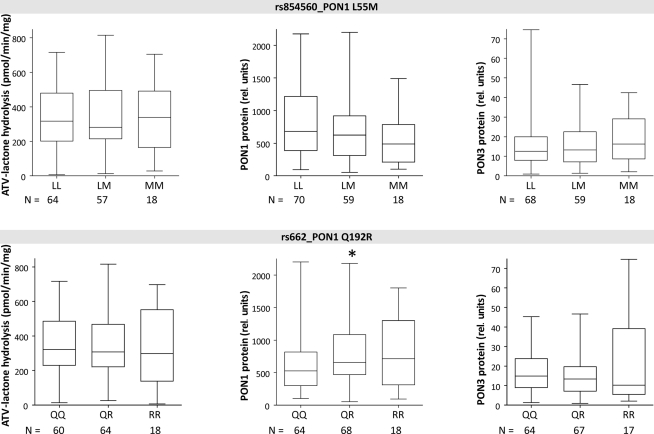
Figure 5.
Boxplots of PON1 and PON3 protein expression and microsomal atorvastatin-lactone hydrolysis in liver microsomes for indicated polymorphisms. Heterozygotes and homozygotes of variant allele are compared with homozygotes of reference allele by Wilcoxon–Mann– Whitney-tests significance levels are indicated for P < 0.05 (*), P < 0.01 (**), and P < 0.001 (***).

