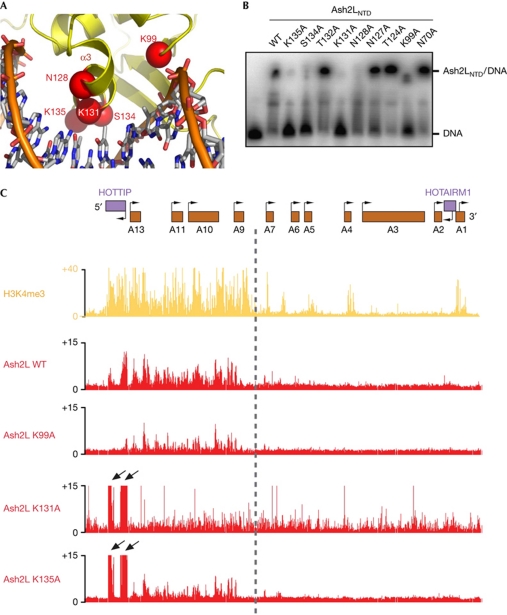
Figure 4.
Mutational analyses of the Ash2LWH–DNA interaction. (A) The modelled interface between helix α3 of Ash2LWH and the DNA major groove. Putative DNA-binding residues in Ash2LWH are labelled. (B) Some point mutations abolished the Ash2LNTD–DNA interaction. A concentration of 0.1 μM of DNA was incubated with 6.4 μM of wild-type (WT) and mutant Ash2LNTD proteins. (C) Chromatin occupancy across approximately 100 kb of HOXA is shown. X axis is the genomic coordinate; Y axis shows occupancy of H3K4me3 or the individual Ash2 L mutant proteins (chromatin immunoprecipitation/input). Point mutations in Ash2LWH lead to decreased occupancy of these proteins across the 5′ HOXA locus (K99A, K135A), increased occupancy over HOTTIP (K131A, K135A) and increased occupancy across the entire HOXA locus (K131A). Arrows highlight peaks of Ash2L occupancy over HOTTIP on changes in DNA binding. HOTTIP, HOXA transcript at the distal tip; WH, winged helix.

