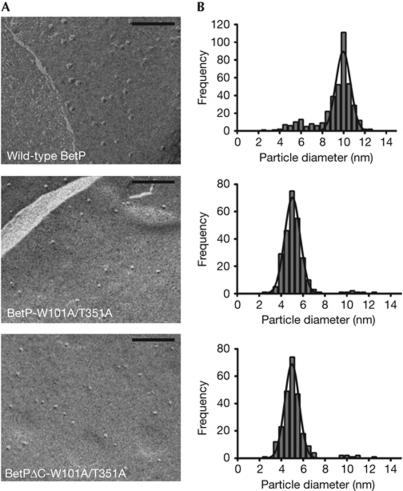
Figure 3.
Results of freeze-fracture electron microscopy. (A) Electron micrographs of membrane-reconstituted wild-type BetP and mutants. Scale bar, 100 nm. (B) Distribution, that is, number of particles counted as a function of particle size. The line in each plot corresponds to a fit to a Gaussian function.

