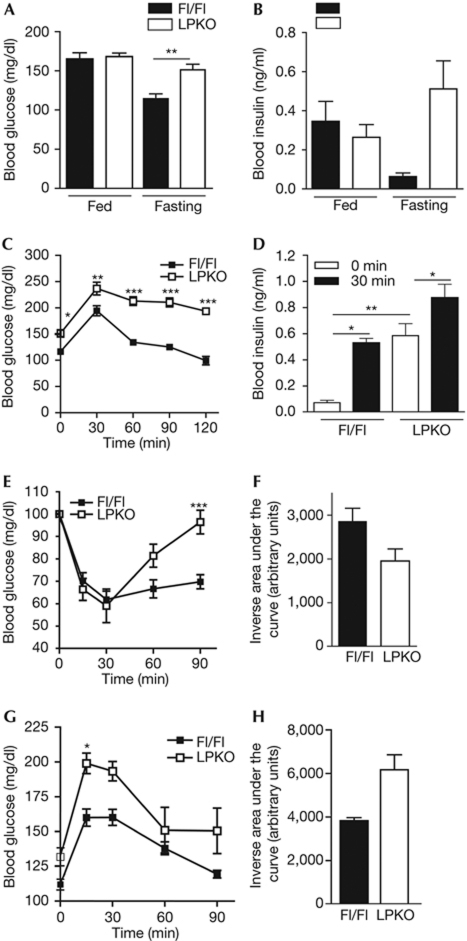
Figure 2.
Impaired glucose homeostasis in LPKO mice. (A) Blood glucose concentrations of fed and fasted (16 h) mice (mean±s.e.m., **P<0.01, Student's t-test, n=3–5). (B) Serum insulin concentrations of fed and fasted mice (mean±s.e.m., **P<0.01, Student's t-test, n=4–5). (C) Glucose tolerance tests in fasted LPKO and Fl/Fl mice (mean±s.e.m., *P<0.05; **P<0.01; ***P<0.001, two-way ANOVA compared with Fl/Fl animals of the same time intervals, n=4). (D) Serum insulin level of fasted mice after high blood glucose challenge (30 min, 2 g/kg, i.p.; mean±s.e.m., *P<0.05; **P<0.01, Student's t-test, n=4). (E) Insulin tolerance test in fasted LPKO and Fl/Fl mice (mean±s.e.m., ***P<0.001, two-way ANOVA compared with Fl/Fl animals at the same time intervals, n=4–5). (F) Inverse area under the curve of the insulin tolerance test in (E) (mean±s.e.m., *P<0.05, Student's t-test, n=4–5). (G) Pyruvate tolerance test in fasted LPKO and Fl/Fl mice (mean±s.e.m., *P<0.05, two-way ANOVA compared with Fl/Fl animals at the same time intervals, n=5). (H) Area under the curve of the pyruvate tolerance test in (G) (mean±s.e.m., *P<0.05, Student's t-test, n=5). ANOVA, analysis of variance; Fl/Fl, PikeFlox/Flox; LPKO, liver-specific Pike knockout.

