Figure 4.
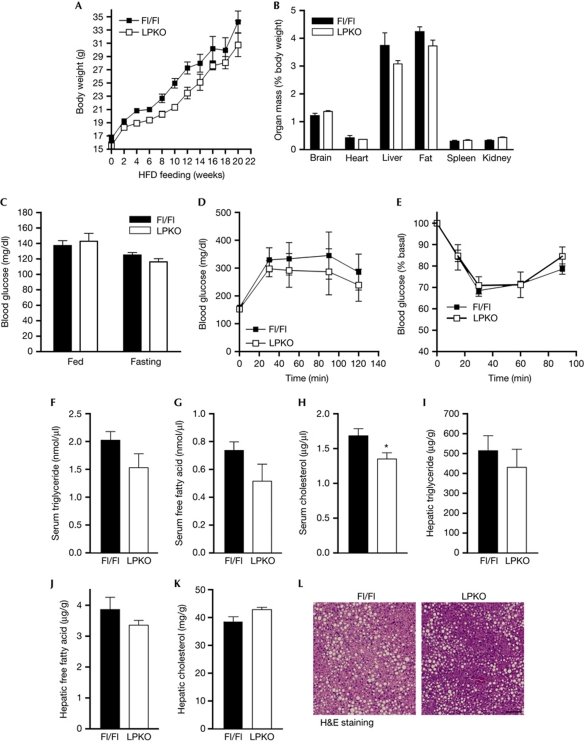
LPKO mice develop obesity and diabetes after 20 weeks of high-fat-diet feeding. (A) Growth curve of HFD-fed mice (starting at 2 months of age; mean±s.e.m. n=5). (B) Organ weight of HFD-fed mice (mean±s.e.m., n=5). (C) Blood glucose concentrations of fasted (16 h) or fed mice after HFD feeding (mean±s.e.m., n=5). (D) Glucose tolerance test of HFD-fed mice (mean±s.e.m., n=5). (E) Insulin tolerance test of HFD-fed mice (mean±s.e.m., n=5). (F–H) Serum triglyceride, free fatty acid and cholesterol concentrations of HFD-fed mice (mean±s.e.m., *P<0.01, Student's t-test, n=5). Blood was collected from fed mice. (I–K) Hepatic triglyceride, free fatty acid and cholesterol concentrations of HFD-fed mice (mean±s.e.m., n=5). Serum and livers were collected from fed mice. (L) Representative image of the liver from HFD-fed mice. Scale bar, 100 μm. Fl/Fl, PikeFlox/Flox; H&E, haematoxylin and eosin; HFD, high-fat diet; LPKO, liver-specific Pike knockout.

