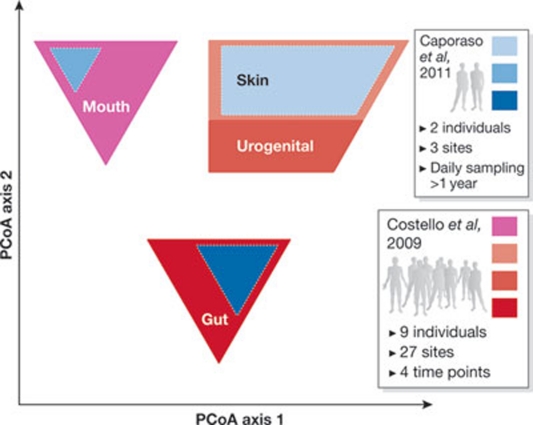
Figure 3.
Variability of the human microbiota. The plot shows the first two axes of the principal coordinate analysis (PCoA), which capture the differences and similarities between communities in each biological sample. The area of each polygon represents the variability within clusters of the samples in each study, indicating that the human microbiome separation is due to its origin (gut, skin, mouth and urogenital) and that there is as much variation over time in one person as there is between adults in a community. Samples from Costello et al (2009), 27 sites in 7–9 healthy adults are shown in red and samples from Caporaso et al (2011a), 3 sites in two adults over 1 year, are shown in blue.

