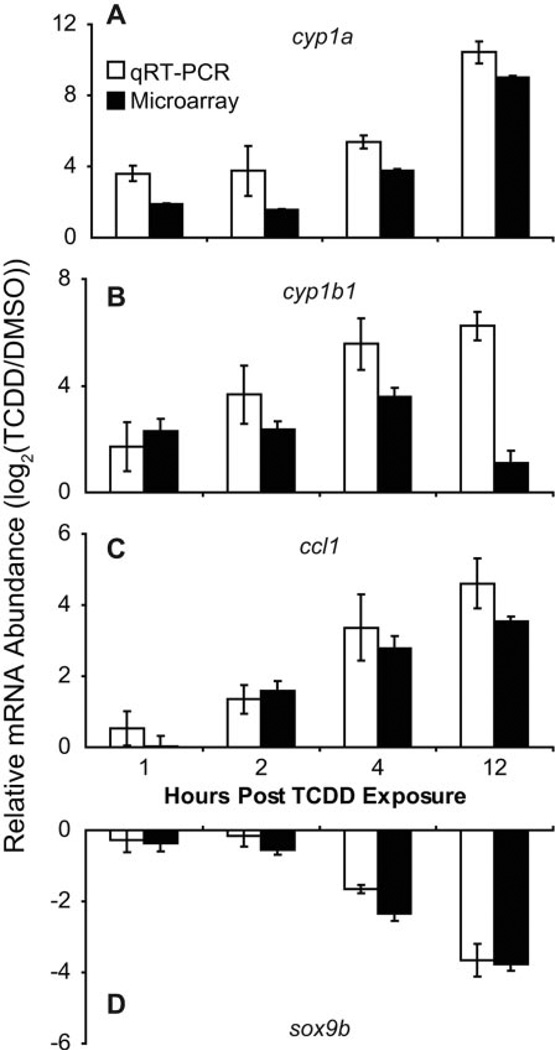
Fig. 4.
Verification of microarray results via qRT-PCR. Zebrafish larvae were exposed to TCDD (1 ng/ml) or vehicle (0.1% DMSO) for 1 h at 96 hpf, and then jaws were collected and pooled in triplicate (10 jaws/replicate) at 1, 2, 4, and 12 hpe (97, 98, 100, and 108 hpf). Total RNA extracted from jaw tissue were reverse-transcribed into cDNA for qRT-PCR measurement of cyp1a (A), cyp1b1 (B), ccl1 (C), and sox9b (D) expression, normalized to β-actin mRNA. The white and black bars represent log2(TCDD/DMSO) for each gene transcript, respectively, from qRT-PCR and microarray analysis, where each bar represents the mean ± S.E. (n = 3).

