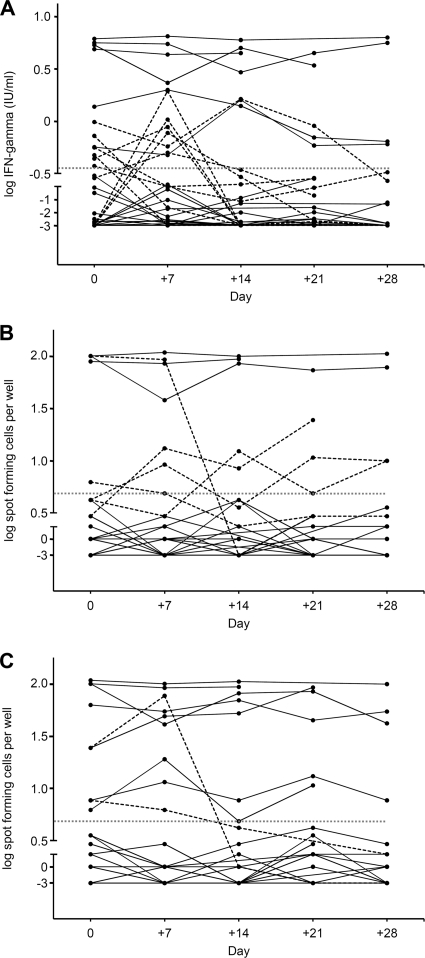
Fig. 2.
Within-subject variability of log IFN-γ responses during five successive study visits for QuantiFERON-TB Gold In-Tube (A), T-SPOT.TB panel A (B) (ESAT-6), and T-SPOT.TB panel B (CFP-10) (C). The dotted gray lines indicate the manufacturers' diagnostic assay thresholds. The dashed lines represent individuals crossing this threshold.

