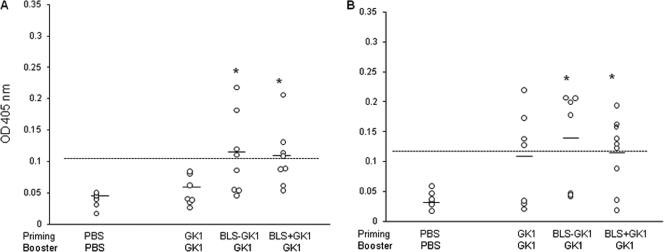
Fig. 1.
Levels of IgG (A) and IgA (B) antibodies against GK-1 in sera developed in mice orally primed with GK, BLS-GK-1, or BLS plus GK-1 and boosted with GK-1. Data are for only 7 or 8 mice because some mice were lost during the last bleeding. Sera were obtained 15 days after the last boost. The mean value of each group is depicted by a line. The dotted line represents the cutoff value, defined as the mean of the OD of the nonimmunized group + 2 standard deviations. *, significant differences (P ≤ 0.05) between naïve and immunized mice were calculated using the nonparametric Mann-Whitney U test. Data are representative of three independent experiments.

