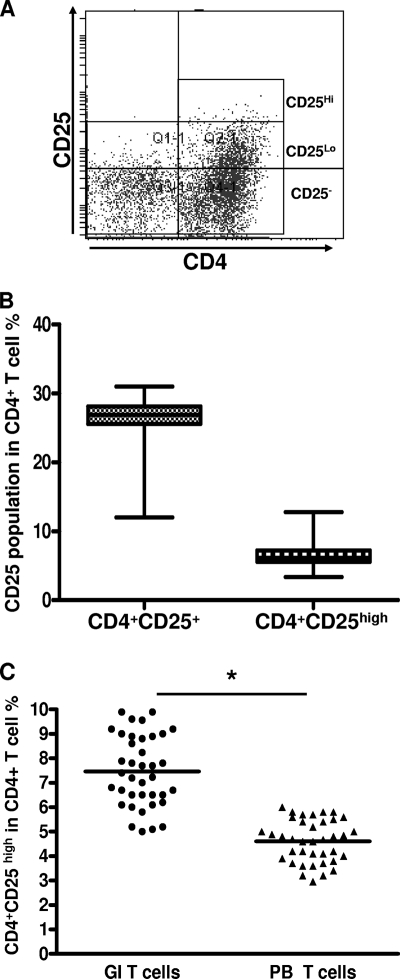
Fig. 1.
Frequency of gastric infiltrating/peripheral blood CD4+ CD25+ regulatory T cells (Tregs) in patients with H. pylori infection. (A) Gastric infiltrating CD4+ T cells were separated into CD25high, CD25low, and CD25− T-cell subsets, as defined by the fluorescence intensity of CD25 obtained using isotypic control antibody. (B) Frequency of gastric infiltrating CD4+ CD25high and total gastric infiltrating CD4+ CD25+ T cells in patients with H. pylori infection. Data are expressed as box plots in which the horizontal lines represent the 25th, 50th, and 75th percentiles of the measured frequencies of Tregs. (C) Percentages of gastric infiltrating (GI)/peripheral blood (PB) CD4+ CD25high Tregs in patients with H. pylori infection. The horizontal bars indicate the median percentages of Tregs. The individual frequency for each subject included in the analysis is shown. Significant of differences were calculated using the Mann-Whitney U test. *, P < 0.05.

