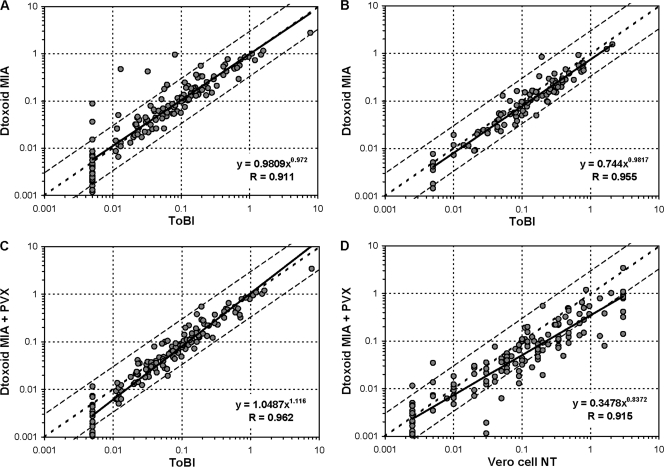
Fig. 2.
Comparison of serum antibody concentrations (IU/ml) as measured by the diphtheria toxoid MIA and ToBI for the DIPNET EQA panel (n = 141) (A) and for a sample subset of the serosurveillance study (n = 96) (B) and by the diphtheria toxoid MIA plus PVX and ToBI (C) and the diphtheria toxoid MIA plus PVX and Vero cell NT (D) for the DIPNET EQA panel (n = 141). The regression line is indicated as a solid line, the line of identity is dotted, and 3-fold deviations are indicated as interrupted lines. Vertical and horizontal dotted lines indicate the cutoffs to determine negative (<0.01 IU/ml), intermediate (0.01 to 0.09 IU/ml), positive (≥0.1 IU/ml) sera.

