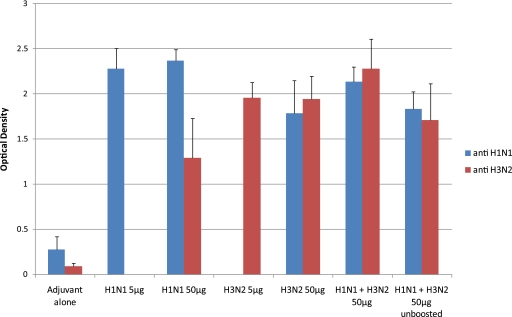
Fig. 1.
Serology on serum samples taken from hens immunized with H1N1 and H3N2 influenza viruses. This graph shows the ELISA results measured as the average OD405 ± standard deviation of individual hen serum samples from the groups immunized with a single viral strain, taken 2 weeks after the second immunization. The graph also shows the ELISA results from the groups immunized with H1N1 and H3N2 viruses in combination, using serum samples taken after 2 immunizations (H1N1 + H3N2 50 μg) or those taken after one immunization (H1N1 + H3N2 50 μg unboosted). The number of samples for each group was as follows: negative-control adjuvant alone, 16 serum samples; H1N1 5 μg and 50 μg, 15 serum samples each; H3N2 5 μg, 9 serum samples; H3N2 50 μg, 12 serum samples; H1N1 + H3N2 50 μg, 10 to 12 serum samples; H1N1 + H3N2 50 μg unboosted, 4 serum samples.

