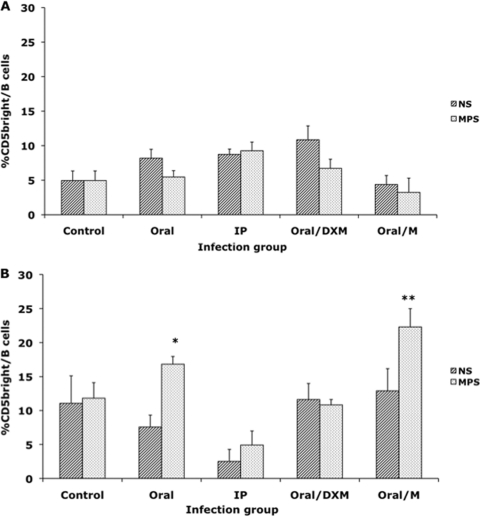
Fig. 4.
Comparison of in vitro stimulation with medium control (NS) and a whole-cell sonicate of Mycobacterium avium subsp. paratuberculosis (MPS) on the percentage of CD5bright B cells from PBMCs isolated from calves at 1 month of infection (A) and 12 months of infection (B). Data are expressed as means ± SEM. Significant differences between NS and MPS-stimulated PBMCs within a treatment group are represented by asterisks (*, P < 0.01; **, P < 0.05).

