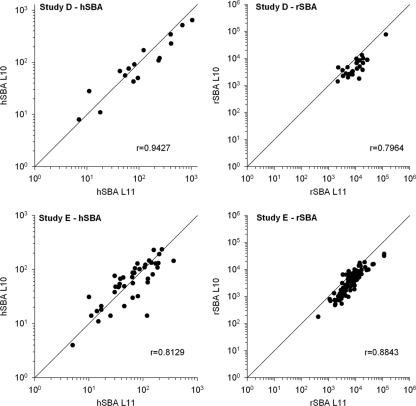
Fig. 2.
Scatter graphs of the correlation (r) between SBA titers measured with the 3125 strain (L10) and F8238 strain (L11) as targets in studies D and E. Study D, left panel, L10-hSBA versus L11-hSBA (n = 16); right panel, L10-rSBA versus L11-rSBA (n = 24). Study E, left panel, L10-hSBA versus L11-hSBA (n = 43); right panel, L10-rSBA versus L11-rSBA (n = 92). Bisector lines (x = y) are shown in each panel.

