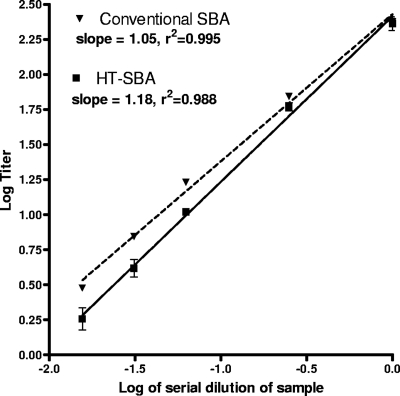
Fig. 6.
Demonstration of the linearity of the alamarBlue assay by serial dilution of the test sample. A test sample is prediluted at different ratios (x axis) and assayed in parallel for CFU or alamarBlue readouts. In both cases, the titer calculated is log transformed and plotted on the y axis. Simple linear regression between titer determined and dilution factor were determined, and the slope and correlation coefficients are listed in the legend.

