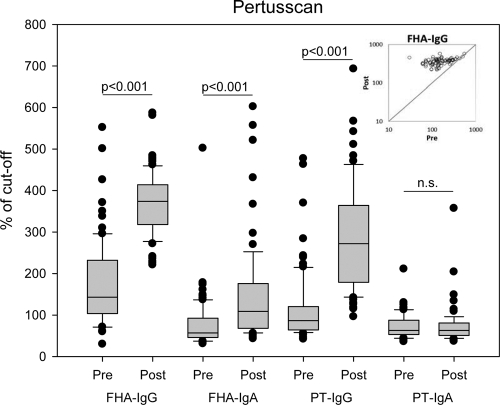
Fig. 2.
Box plot showing the serum IgG and IgA responses against PT and FHA as measured by the Pertusscan ELISA of the sera before and after the administration of the fifth dose; n=80 and 75 in pre- and postvaccination groups, respectively. The scatter plot in the inset shows the FHA-IgG distribution of the 75 paired pre- and postvaccination sera. Results are from one experiment.

