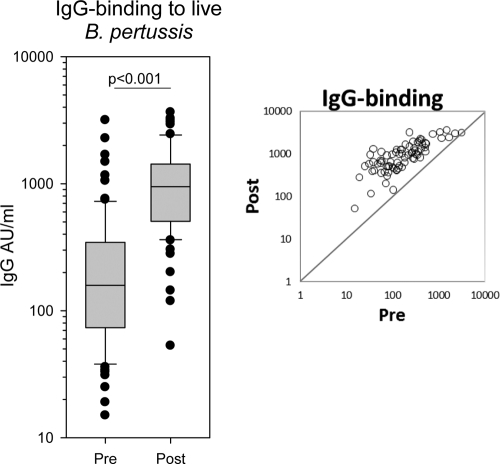
Fig. 5.
Box plot showing IgG binding against live B. pertussis in sera before and after the fifth dose. The activities were quantified in arbitrary units using an in-house reference serum. A single measurement using serial 2-fold dilutions of serum was examined; n=80 and 75 in pre- and postvaccination groups, respectively. The scatter plot shows the distribution of IgG binding of the 75 paired pre- and postvaccination sera.

