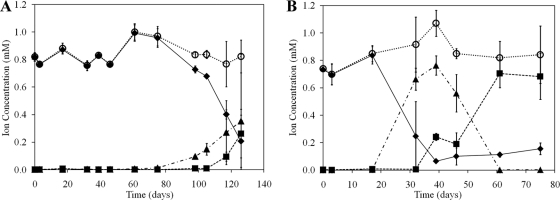
Fig. 2.
Concentrations of NH4+ (⧫), NO2− (▴), NO3− (▪), and total soluble N (○) as a function of time in microcosms incubated at 4°C (A) and 15°C (B) with 1 mM NH4+ added. Total soluble N is the sum of the concentrations of NH4+, NO2−, and NO3−. Values represent the difference in concentrations between biological replicates and killed controls. The standard deviation of three replicates is indicated.

