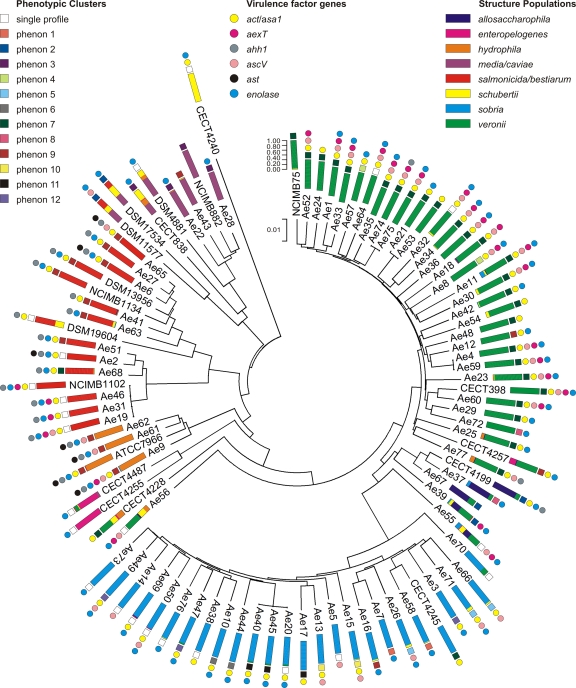
Fig. 1.
Neighbor-joining phylogenetic tree of 96 Aeromonas strains constructed from the concatenated sequences of the six genes included in this study. Colored rectangles represent the eight ancestral populations identified with Structure analysis. For each strain, the length of the colored segments indicates the proportion of nucleotides from each of the eight ancestral populations. Colored circles indicate, for each strain, the presence of the virulence factor genes analyzed in this study. Colored squares represent the phenotypic clusters obtained with Jaccard's coefficient. The scale bar length correlates with the length of the concatenated sequence, expressed as a percentage.

