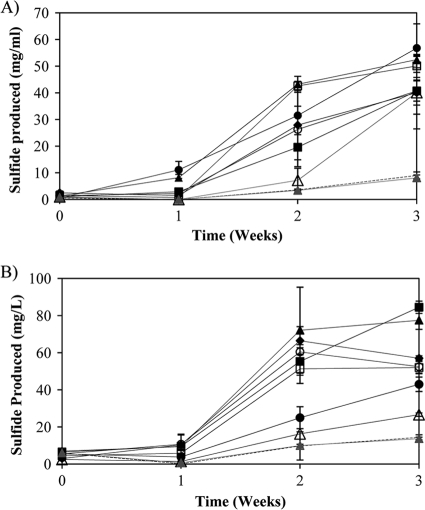
Fig. 4.
Sulfide production in microcosms incubated at 37°C (A) and 70°C (B). Solid black lines represent the amount of sulfide produced over time in microcosms that contained drilling water and sterile drilling mud. The symbols that accompany the solid black lines indicate which mud samples were added to these microcosms: ▵, AI mud; □, AJT mud; ⧫, BY mud; •, GA mud; ▪, GRT mud; ○, RE mud; ▴, SM mud. The dashed black lines represent the amount of sulfide produced over time in microcosms that contained only drilling water. The solid gray lines marked with a gray triangle represent the amount of sulfide produced over time in microcosms that contained drilling water and 10 mM sodium sulfate.

