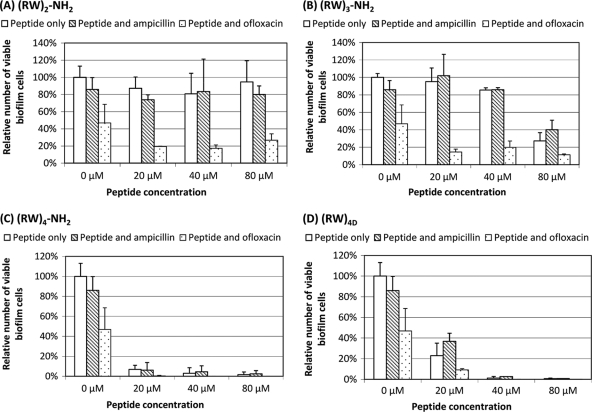
Fig. 4.
Effects of (RW)2-NH2 (A), (RW)3-NH2 (B), (RW)4-NH2 (C), and (RW)4D (D) on biofilm cells of E. coli HM22. The graphs show the effects of 1-h treatment of peptides on biofilms preformed on 316L biofilm coupons at three different drug concentrations (20, 40, and 80 μM). The first three bars in each graph represent the peptide-free control. White bars represent the relative numbers of total viable biofilm cells with or without peptide treatments; gray bars represent the relative numbers of viable biofilm cells after the above-described peptide treatment, followed by a 3-h treatment of 100 μg/ml ampicillin; and white dotted bars represent the relative numbers of total biofilm-associated persister cells after the above-described peptide treatment, followed by a 3-h treatment with 5 μg/ml ofloxacin. Means and standard deviations are shown. Data were analyzed with one-way ANOVA.

