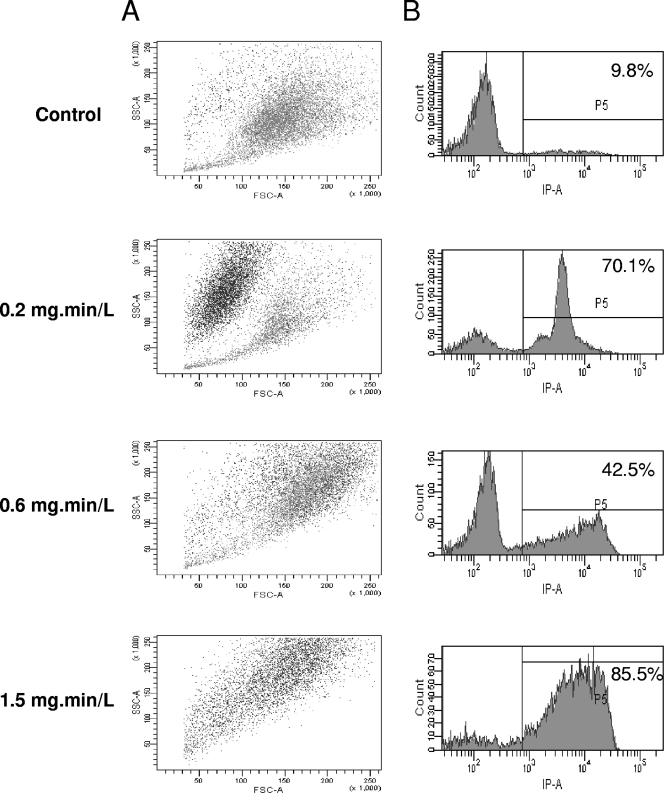
Fig. 3.
Chlorine dioxide activity on A. castellanii assessed by flow cytometry. (A) SSC is represented in function FSC, where each spot corresponds to PI-positive cells (black) or PI-negative cells (gray). (B) The number of cells is represented in the function of PI fluorescence. The ratio of PI-positive cells (>8 × 10²) as given as a percentage.

