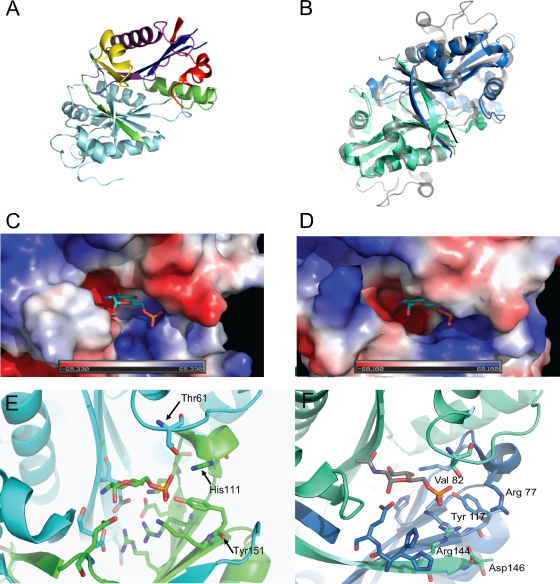
Fig. 4.
Crystal structure of TbGNA1. (A) Representation of the two domains present in the TbGNA1 monomer from N-terminal motif C (red), motif D (blue), motif A (violet), and motif B (yellow). Light blue, the second chain that forms the dimer. (B) Overall structure comparison of TbGNA1 (cyan and blue, for each domain in the dimeric structure) and HsaGNA1 (gray). Arrows point to the C-terminal discrepancies between H. sapiens and T. brucei at the entrance to the sugar binding site. (C) Close-up of the HsaGNA1 active site, representing the surface charge and shape of the pocket. The ribbon cartoon shows the specific interactions with the substrates. (D) TbGNA1 active site, representing the surface charge and shape of the pocket. (E) Ribbon cartoon with sticks showing the specific interactions with the substrates in H. sapiens GNA1 structure (green and blue, corresponding to different domains). (F) Ribbon cartoon with sticks showing the specific interactions with the substrates in T. brucei GNA1 structure. As TbGNA1 could not be crystallized in the presence of substrates, the figure is created by modeling in an N-acetyl-d-glucosamine-6-phosphate from the human structure.

