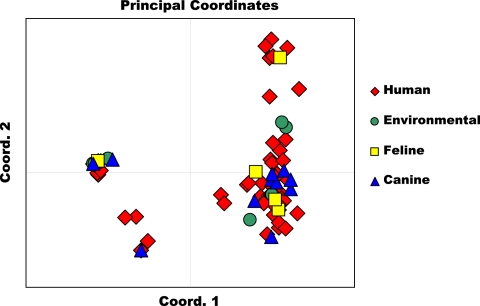
Fig. 3.
Principal coordinate analysis was performed using a covariance matrix of individual pairwise allele-sharing distances in the program Genalex, version 6.4 (31). Analysis showed separation of Blastomyces dermatitidis isolates into two main genetic groups, with the coordinate 1 axis explaining 61.41% of the variability. Isolates obtained from various hosts and environmental isolations were distributed among the genetic groups.

