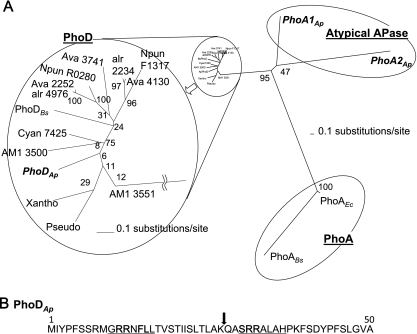
Fig. 2.
(A) Phylogenetic analysis of APases. A radial tree of the APases shows PhoA1Ap (accession number, AB602344), PhoA2Ap (AB602345), and PhoDAp (AB602343) from A. halophytica; AM1 3550 (AM1_3550) and AM1 3551(AM1_3551) from Acaryochloris marina MBIC11017, Cyan7425 (Cyan7425_1386) from Cyanothece sp. strain PCC 7425, Ava 2252 (Ava_2252), Ava 3741 (Ava_3741), and Ava 4130 (Ava_4130) from Anabaena variabilis ATCC 29413, alr 2234 (alr2234) and alr 4976 (alr4976) from Anabaena sp. strain PCC 7120, Npun R0280 (Npun_R0280) and Npun F1317 (Npun_F1317) from Nostoc punctiforme PCC 73102, Pseudo (EFW82021) from Pseudomonas syringae pv. glycinea strain B076, Xantho (YP_001905643) from Xanthomonas campestris, PhoABs (BSU09410) and PhoDBs (BSU02620) from Bacillus subtilis, and PhoAEc (b0383 JW0374) from Escherichia coli. The bars represent evolutionally distance. The scale bar is 0.1 expected changes per amino acid site. The reliability of the tree was measured by bootstrap analysis with 1,000 replicates. The branches of the PhoD proteins were magnified for clarity. (B) Predicted signal peptides for PhoDAp. Underlined text denotes Tat consensus motifs. An arrow at the position between 26 and 27 denotes the peptide cleavage site as predicted by SignalP, version 3.0.

