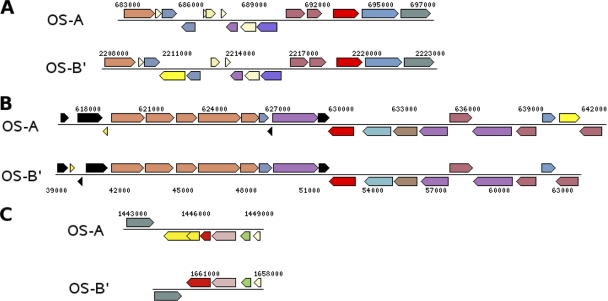
Fig. 3.
Putative laterally transferred regions contain ISSoc sequences. The syntenic regions displayed (A, B, and C) are >93% identical (nucleotide identity). Numbers indicate genome coordinates. The OS-B′ region in panel C is presented reversed for ease of display. Genes in red indicate ISSoc transposase genes that are syntenic in both isolates. Genes in yellow indicate ISSoc transposase genes found in only one of the isolates. Other colors indicate genes with similar functional annotations and illustrate the overall synteny of the region. The figure was adapted from images generated by the IMG Chromosome Viewer (22).

