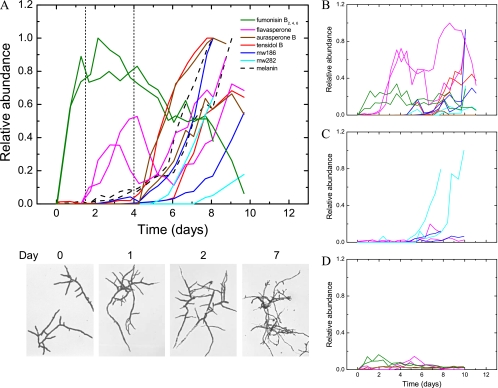
Fig. 4.
Temporal profiles of secondary-metabolite accumulation in the culture media of duplicate retentostat cultures. The metabolite concentrations are relative to the largest area determined for each metabolite. (A) Reference metabolite profile of N402 with pictures showing morphological differentiation over time (analyses of samples from reference 21) (below). (B to D) Profiles for the ΔfwnA strain (MA93.1) (B), the scl-1 strain (JP5.1) (C), and the scl-2 strain (MA146.1) (D). The two vertical dashed lines indicate the first observation of conidiophores and subsequent commitment to conidiation in cultures of N402 (22).

