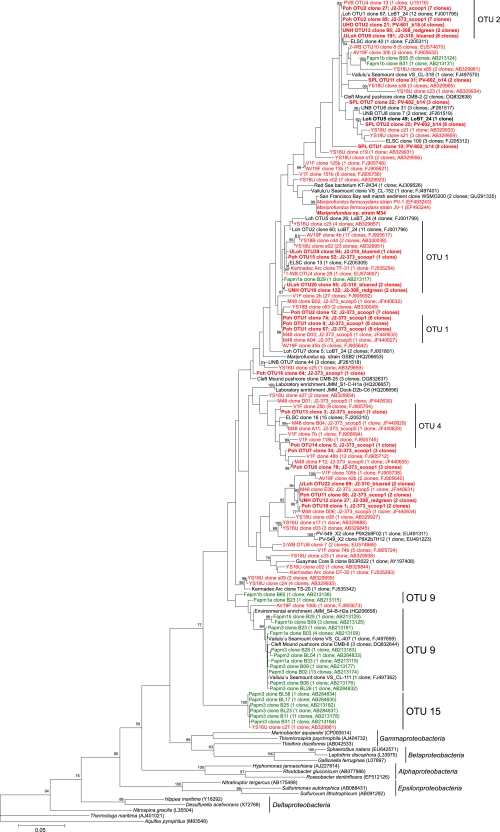
Fig. 3.
Maximum likelihood phylogenetic tree showing the evolutionary placement of all 132 full- and partial-length Zetaproteobacteria sequences used in this study (696-bp mask). Red and green groupings indicate clones from microbial mats and borehole fluids, respectively. Novel sequences from this study are highlighted in boldface. Selected OTUs are indicated for reference. GenBank accession numbers for published sequences are shown in parentheses, in addition to the number of clones represented by each sequence. Only bootstrap values above 50 are shown. The scale bar represents 5 nucleotide substitutions per 100 positions.

