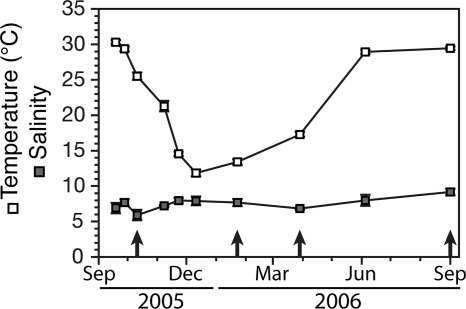
Fig. 2.
Average temperature and salinity in Lake Pontchartrain over the course of the year following landfall of Hurricane Katrina. The error bars for the temperature and salinity are the standard deviations among the 13 stations sampled at each time point. When bars are not visible, the error is less than the height of the symbol. The arrows indicate the dates on which samples were collected for analysis as part of this study.

