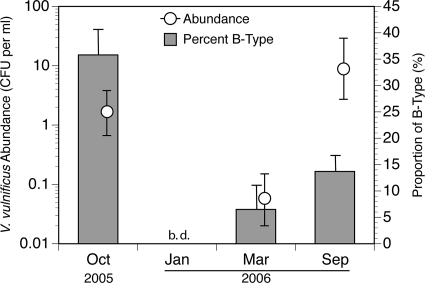
Fig. 5.
Estimated geometric mean concentrations of V. vulnificus in Lake Pontchartrain (open circles) and the percentages that were 16S rRNA biotype B for each sampling period (bars). No data are shown for January 2006 because CFU of V. vulnificus were below the detection limit of the assay (<0.04 CFU ml−1) and no isolates were obtained at that time. The error bars for V. vulnificus abundance were propagated from multiple sources of error, as described in Materials and Methods. The error bars on the bar graph show 95% confidence intervals. The proportion of B-type V. vulnificus in October was significantly different (P < 0.05) from that in the other months according to two statistical tests (a two-tailed Fisher's exact test and a chi-square approximation). Abundance data are slightly offset to the right for clarity.

