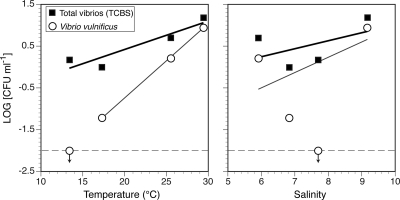
Fig. 7.
Linear regression analysis of log-transformed concentrations of total CFU on TCBS and V. vulnificus CFU in Lake Pontchartrain versus lake temperature (left) and salinity (right). The concentrations are the geometric mean abundances for the 13 lake stations. The temperature and salinity values are the arithmetic means for those stations. The thicker regression lines are for the total vibrio data, and the thinner lines are for V. vulnificus. The horizontal dashed lines indicate the detection limit of our assay. In each panel, the value for V. vulnificus located at the detection limit with the downward-pointing arrow represents data from January, at which time no V. vulnificus cells were detected. These points were not included in the regression. The regression equations (rounded to three significant digits) are as follows: left, thick line, y = 0.0673x − 0.929, r2 = 0.858, P = 0.074, and thin line, y = 0.178x − 4.30, r2 = 1.000, P = 0.014; right, thick line, y = 0.190x − 0.893, r2 = 0.243, P = 0.507, and thin line, y = 0.364x − 2.68, r2 = 0.309, P = 0.625.

