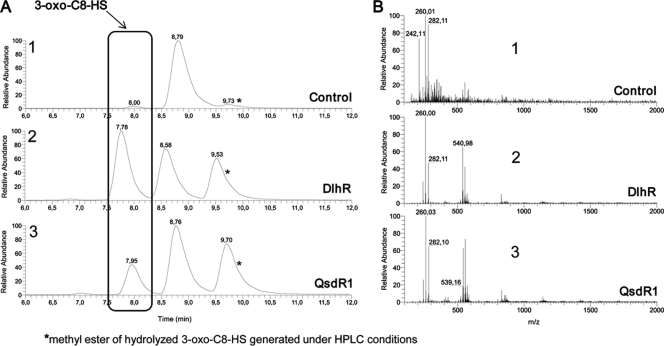
Fig. 4.
HPLC-MS analysis of recombinant DlhR and QsdR1. (A) HPLC-UV spectra recorded at 252 nm for 3-oxo-C8-HSL after incubation with GtfU as a control, DlhR, and QsdR1. (B) Respective mass spectra recorded for samples treated with either control protein GtfU, DlhR, or QsdR1. (A1) The HPLC-UV chromatogram depicts the control incubated with 3-oxo-C8-HSL, displaying only one distinct peak at an Rt of 8.8 min representing 3-oxo-C8-HSL. No lactone hydrolysis could be observed. (B1) The mass spectrum of the GtfU control (at an Rt of 8.0 min) shows an (M + H)+ ion at an m/z of 242.1 as significant for this compound. An (M + H)+ ion at an m/z of 260.01 and an (M + Na)+ ion at an m/z of 282.1 were also detected owing to spontaneous degradation of 3-oxo-C8-HSL. (A2) HPLC-UV chromatogram for 3-oxo-C8-HSL incubated with DlhR, showing the peak at an Rt of 7.8 min for the cleavage product 3-oxo-C8-HS (opened lactone ring). The peak at an Rt of 8.6 min indicates the unhydrolyzed 3-oxo-C8-HSL, and an irrelevant by-product (a methyl ester), which is generated only under HPLC conditions, was detected at an Rt of 9.6 min. (B2) The corresponding mass spectrum shows three characteristic ions: an (M + H)+ ion at an m/z of 260.0, an (M + Na)+ ion at an m/z of 282.1, and a (2M + Na)+ ion at an m/z of 540.2. (A3) HPLC-UV chromatogram of 3-oxo-C8-HSL hydrolyzed by QsdR1. The cleavage product, an opened lactone ring form, was detected at an Rt of 8.0 min; consequently, QsdR1 was able to enzymatically degrade 3-oxo-C8-HSL. Both peaks for the nonhydrolyzed form of 3-oxo-C8-HSL as well as the methyl ester were recorded for QsdR1 as well. (B3) The mass spectrum as already given for DlhR showed the characteristic ions [an (M + H)+ ion, an (M + Na)+ ion, and a (2M + Na)+ ion at the same m/z].

