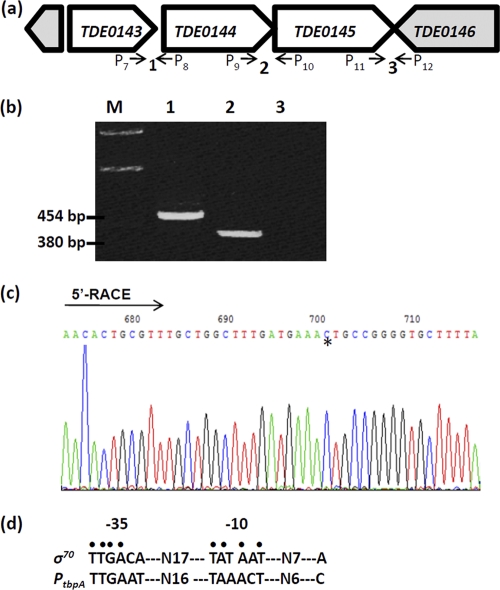
Fig. 3.
Transcriptional analysis of the tbpABCTd operon. (a) Diagram showing the genes near TDE0143. The numbers and small arrows show the primers used for the RT-PCR analysis. (b) RT-PCR analysis. The lane numbers correspond to the primers labeled in panel a, and the sequences of these primers are described in Table 1. Lane M, 1.0-kb DNA ladder. (c) 5′-RLM-RACE analysis. The arrow shows the sequencing direction, and the asterisk indicates the identified transcriptional start site. (d) Comparison of the identified promoter sequence with the consensus sequence of the E. coli σ70 promoter. The conserved nucleotides are dotted.

