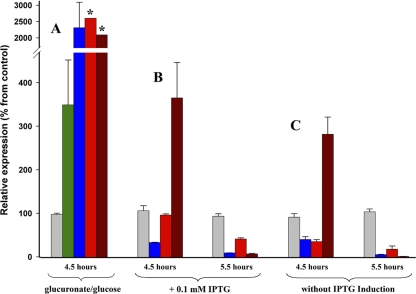
Fig. 5.
Effect of UxuR on the expression of target genes as measured by qPCR. Bars represent the average abundance of the hns (gray), uxuB (blue), yjjM (bright red), yjjN (dark red), and uxuR (green) mRNAs in experimental bacterial cultures compared to the control samples. (A) Relative expression of genes within cells grown in minimal M9 broth, supplemented with 0.2% d-glucose (control sample) or d-glucuronate (experimental culture). Assays indicated by asterisks in four biological replications (8 to 10 technical repeats) vary in the ranges of 250 to 6,900% (yjjM) and 150 to 4,200%. (B and C) Cells transformed by either pGEMU (experimental culture) or pGEM (control sample) were grown in the presence (B) or absence (C) of IPTG and harvested after 4.5 or 5.5 h of cultivation. (B) IPTG (0.1 mM) was added to bacterial cultures after 3.5 h (optical density at 600 nm = 0.4). Induction was allowed for 1 or 2 h, and the cells were harvested as described in panel C. Bars represent average values of changes registered in three independent experiments, with two concentration variables in each experiment. High UxuR-specific bars (see the text) are eliminated from the panels B and C so as to increase the resolution of the plot.

