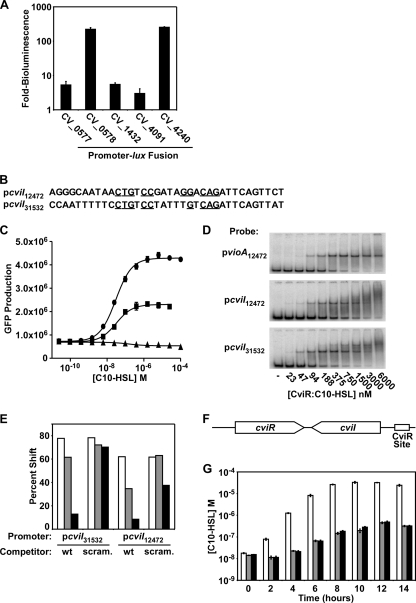
Fig. 4.
Identification of targets of CviR regulation. (A) CviR activation of candidate promoters. Fusions between the indicated C. violaceum promoters and luxCDABE were tested for autoinducer-dependent activation of bioluminescence in E. coli expressing CviR. Shown are averages for four replicates; error bars correspond to one standard deviation from the mean. (B) Predicted CviR-binding region in the cviI promoter from C. violaceum strain 31532 (pcviI31532) and C. violaceum strain 12472 (pcviI12472). Residues identical to those in the ideal CviR binding site are indicated with underlines. (C) Dependence of cviI activation on the predicted CviR binding site. The C. violaceum strain 12472 vioA promoter (circles), the cviI promoter (squares), and the cviI promoter containing a scrambled CviR binding site (triangles) were fused to the GFP gene. GFP production in response to various concentrations of C10-HSL was measured. (D) CviR binding to the cviI promoter. PCR-amplified vioA or cviI promoter DNA from C. violaceum strain 12472 or 31532 was radiolabeled and added to the indicated concentration of purified CviR:C10-HSL. Complexes were resolved by PAGE and analyzed using a phosphorimager. (E) CviR competitive gel shift. CviR:C10-HSL (1 μM) was added to radiolabeled cviI promoter DNA from either C. violaceum strain 12472 or 31532. Competitor wild-type (wt) cviI promoter DNA or cviI promoter DNA containing a randomized CviR binding site (scram.) was added to binding reaction mixtures to a final concentration of 5 nM (white bars), 30 nM (gray bars), or 150 nM (black bars) and analyzed as for panel D. All results are typical of at least three independent experiments. (F) Schematic of the cviI-cviR locus, encoding the autoinducer synthase (cviI), the autoinducer receptor (cviR), and the CviR binding site in the cviI promoter. (G) Role of positive feedback in autoinducer synthesis. Plasmid pcviIR (white bars), pcviIRstop (pcviIR containing a stop codon in cviR) (gray bars), or cviI*R (pcviIR containing a mutant CviR binding site in the cviI promoter) (black bars) was introduced into E. coli. The concentration of C10-HSL in cell-free culture fluids was determined. Shown are averages for three replicates; error bars correspond to one standard deviation from the mean.

