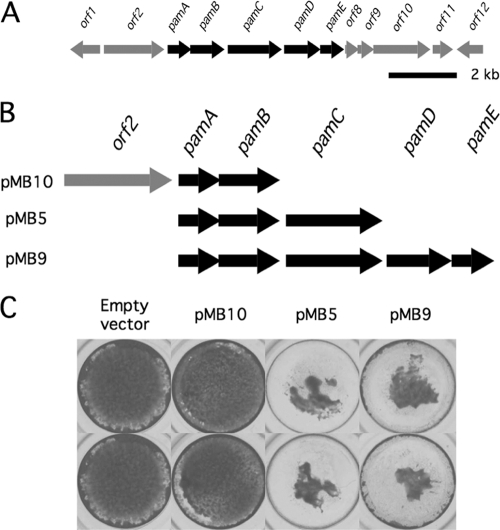
Fig. 7.
Expression of the K. kingae pam genes in E. coli. (A) Genetic map of the K. kingae pam genes and surrounding region. Arrows indicate open reading frames and direction of transcription. Scale bar, 2 kb. (B) Genetic maps of expression plasmid inserts. (C) Inhibition of S. aureus biofilm formation by colony biofilm extracts isolated from plasmid-harboring E. coli strains. Biofilms were stained with crystal violet and photographed. Duplicate wells are shown.

