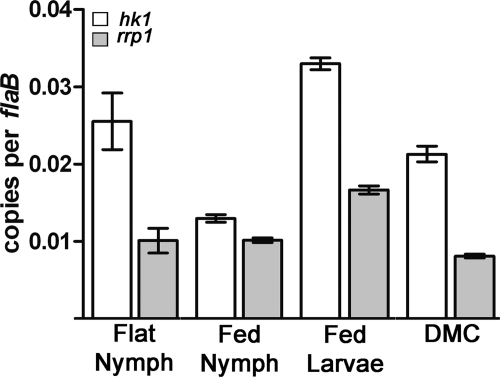
Fig. 1.
Expression profiling of hk1 and rrp1. Values represent the average flaB-normalized transcript copy number ± standard error of the mean for each gene. Values for hk1 were significantly different (P < 0.05) for the following comparisons: flat nymph versus fed larvae and fed nymph, fed larvae versus fed nymph and DMC, and fed nymph versus DMC. Values for rrp1 were significantly different (P < 0.05) for the following comparisons: fed larvae versus flat nymph, fed nymph and DMC, and DMC versus flat nymph and fed larvae. hk1 was expressed at significantly (P < 0.05) higher levels than rrp1 in the same sample under all four conditions examined. The sequences of the forward and reverse primers used to detect hk1 and rrp1 are provided in Table 2, and their locations are shown in Fig. 2A (hk1-F and hk1-R are designated by arrows 3 and 4, respectively; rrpl-F and rrpl-R are designated by arrows 5 and 6, respectively).

