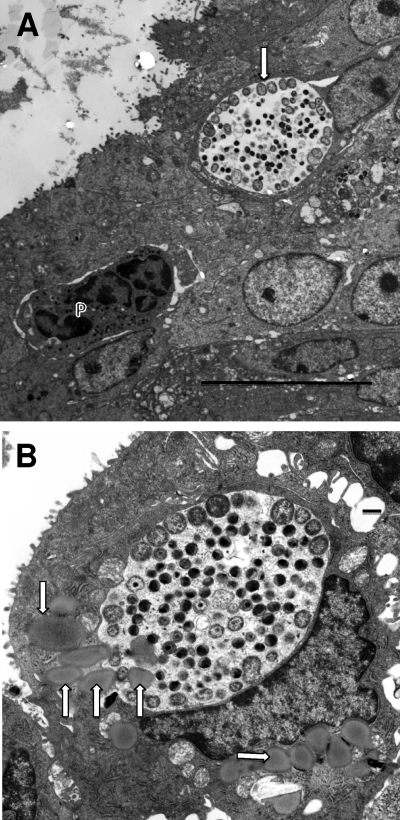
Fig. 6.
Inclusions at 42 h after infection. (A) Note that the majority of the RBs in this inclusion (arrow) are along the periphery of the inclusion adjacent to the inclusion membrane while the EBs are in the internal portion. (B) Again, the majority of the RBs are attached to the inclusion membrane. Note the multiple lipid droplets (arrows) in the infected cell. On the left side of the inclusion, lipid droplets are actually entering the inclusion, suggesting an active process of droplet translocation. Scale bars: 10 μm (A), 500 nm (B).

