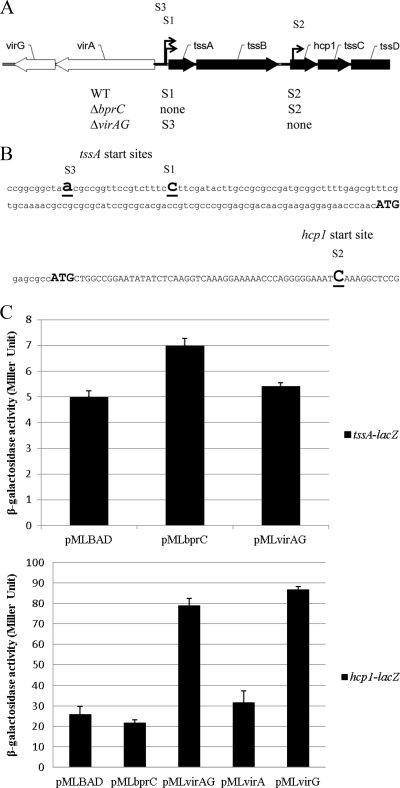
Fig. 3.
Transcriptional analysis of T6SS-1. (A) Transcriptional organization of T6SS-1 genes in KHW, ΔbprC, and ΔvirAG strains. S1, S2, and S3 indicate start sites. Arrows indicate transcription direction. WT, wild type. (B) Start sites of transcription. Bold and underlined letters indicate start site (+1). Bold ATGs indicate initial codon of proteins. (C) Effect of bprC and virAG on the expression of tssA-lacZ and hcp1-lacZ fusions in E. coli. Values given are means ± standard deviations.

