Fig. 4.
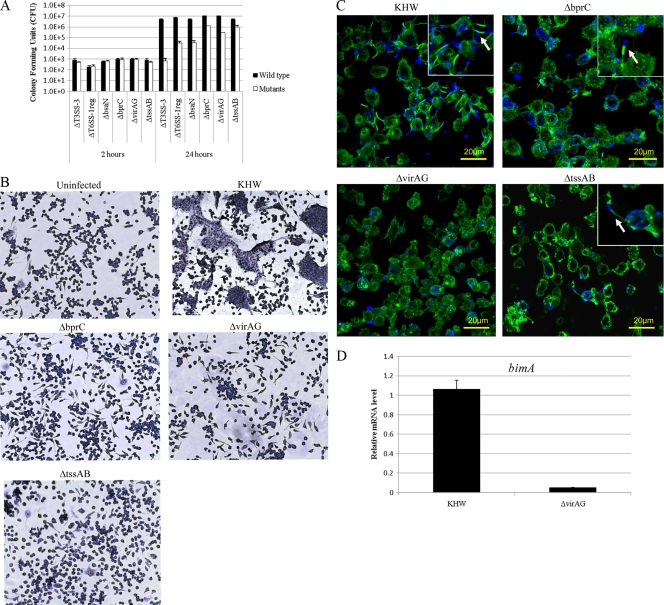
Intracellular replication, MNGC formation, and actin tail formation of T6SS-1 mutants. (A) Intracellular replication of B. pseudomallei in RAW 264.7 cells. Cells were infected at an MOI of 0.1:1. Intracellular bacterial loads were quantified at 2 and 24 h postinfection by plate counting. The values are the means ± standard deviations of biological triplicates. (B) Light micrographs of Giemsa-stained RAW 264.7 cells infected with B. pseudomallei. The monolayers were visualized at 10 h postinfection and were infected at an MOI of 10:1. (C) Confocal micrographs of actin tail polymerization by various B. pseudomallei strains. Cells were infected with KHW and ΔbprC, ΔvirAG, and ΔtssAB mutants for 8 h at an MOI of 10:1. Bacteria were stained blue with rabbit anti-B. pseudomallei LPS and anti-rabbit IgG Alexa Fluor 405; actin was stained green with Alexa Fluor 488 phalloidin. The arrow indicates actin tail formation at one pole of the bacteria. (D) The expression levels of the bimA gene in the ΔvirAG mutant measured by real-time PCR.

