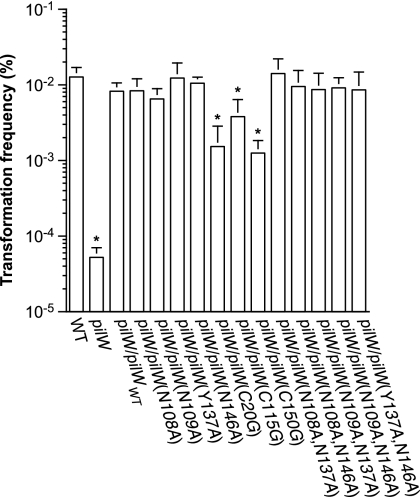
Fig. 3.
Quantification of competence for DNA transformation in PilW variants constructed in this study. The WT strain and the pilW mutant were included as positive and negative controls, respectively. Results are expressed as percentages of recipient cells transformed and are the means ± standard deviations from 4 to 6 independent experiments. Results statistically significantly different from the WT strain (P ≤ 0.01), as assessed by two-tailed Student's t test, are indicated by an asterisk.

