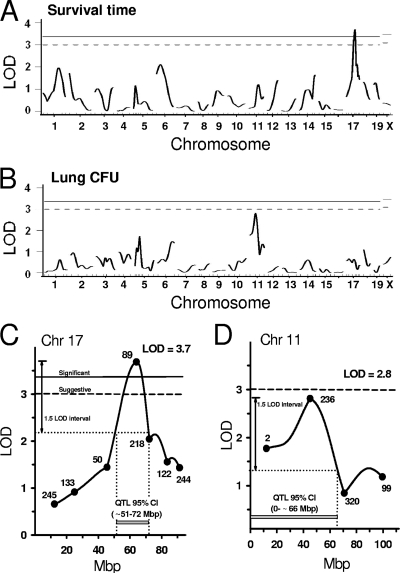
Fig. 8.
LOD plots for the CD2F2 population (generated from BALB/cJ and DBA/2J progenitors) infected with Bacillus anthracis Ames spores. A total of 258 F2 mice were exposed to 2,000 Ames spores and monitored for survival time and total lung burden (CFU). (A and C) Results of survival time analysis for genome-wide (A) and chromosome 17 only (C). (B and D) Lung CFU results following infection for genome-wide (B) and chromosome 11 only (D) analysis. Genome-wide threshold values that were significant (solid lines; LOD, 3.37) or suggestive (dashed lines; LOD, 3.00) are shown, as established by 10,000 permutations of the data set. Symbols with numbers represent positions of the listed Mit microsatellite markers genotyped in the full F2 population. The 95% confidence interval for the QTLs (chromosomes 11 and 17) were established by the area marked with a 1.5-LOD drop from the peak.

