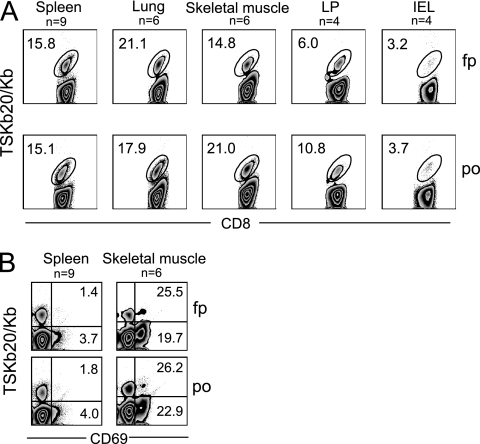
Fig. 2.
T. cruzi-specific CD8+ T cells traffic to peripheral tissues and are activated in sites of parasite persistence independently of infection route. (A) Flow plots show the frequency of TSKb20-specific CD8+ cells in the indicated tissue of f.p.- or p.o. infected mice during acute T. cruzi infection. (B) Recently activated T. cruzi-specific CD8+ T cells are present in sites of persistence. Flow plots are gated on CD8+ T cells isolated from spleen or skeletal muscle of f.p.- or p.o. infected mice and show CD69 expression on TSKb20-specific cells. Numbers indicate the frequency of TSKb20+ CD8+ (top right) or TSKb20− CD8+ (bottom right) T cells expressing CD69. Numbers in flow plots are the average frequency obtained from mice sacrificed between 19 and 39 dpi. The number of data points (n) is shown for each group; some data points comprise cells isolated from the pooled tissue of two or three mice harvested on the same day.

