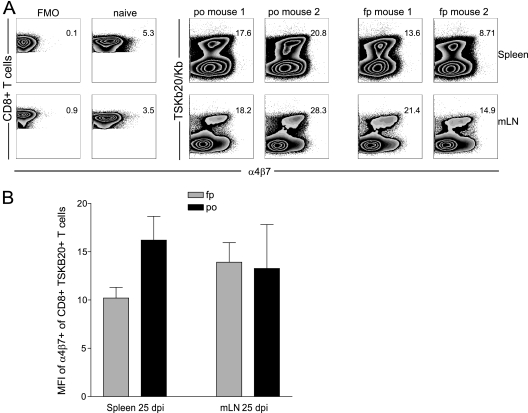
Fig. 3.
Oral infection route does not skew T. cruzi-specific CD8+ T cells toward a gut homing phenotype. Lymphocytes were isolated from spleen (top) and mLN (bottom) of T. cruzi-infected mice at 25 dpi and naïve age-matched mice, and surface expression of α4β7 was assessed by flow cytometry. (A) Fluorescence minus one (FMO) and naïve CD8+ T staining controls for α4β7 expression are shown (left). Expression of α4β7 among TSKb20-specific CD8+ T cells is shown for 2 representative mice from a total of 5 mice (right). Flow plots are gated on CD8+ T cells. Numbers indicate the median fluorescence intensity (MFI) of CD8+ T cells for FMO and naïve samples and the MFI of TSKB20+ CD8+ T cells for the orally or footpad-infected mice. (B) Mean ± SEM of MFI for α4β7 expression on TSKB20+ CD8+ T cells. n = 5 mice per group.

