Fig. 4.
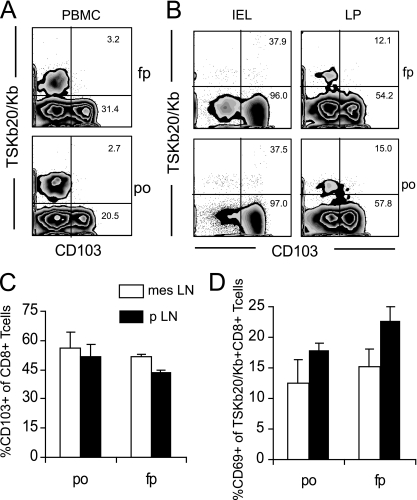
Route of infection does not affect the distribution of TSKb20+ CD103+ CD8+ T cells or activation of TSKb20+ CD8+ T cells in gut-draining LN. (A) Gut-imprinted CD8+ T cells specific for T. cruzi are not detectable in blood early in infection. PBMC from mice at 14 dpi were isolated, and CD103 expression among TSKb20-specific cells was assessed by flow cytometry. Numbers in flow plots indicate the average percentage of TSKb20+ CD8+ (top) or TSKb20− CD8+ (bottom) T cells that express CD103 (f.p., n = 5; p.o., n = 10). (B) CD103 is expressed by gut CD8+ T cells, but by few T. cruzi-specific CD8+ T cells. IEL and LP lymphocytes were isolated from T. cruzi-infected mice between 19 and 39 dpi, and surface expression of CD103 was assessed by flow cytometry. Flow plots are gated on CD8+ T cells. Numbers indicate the average percentage of TSKb20+ CD8+ (top) or TSKb20− CD8+ (bottom) CD8+ T cells that express CD103, from 4 similar experiments. (C) Flow cytometry was used to assess the proportion of all CD8+ T cells expressing CD103 in pLN and mesLN of mice after f.p. and p.o. infection with T. cruzi. Bars show average percentage of CD103+ CD8+ cells ± SEM. (D) The proportion of recently activated TSKb20+ CD8+ T cells in different lymph nodes was assessed by flow cytometry. Bars show average percentage of CD103+ CD8+ cells ± SEM. n = 3 mice per group. Similar data were obtained in a replicate experiment.

