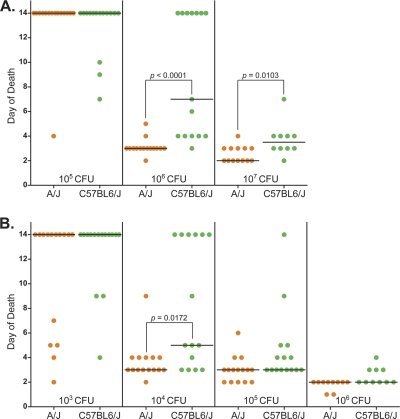
Fig. 1.
Dose response of A/J and C57BL/6J mice to B. cereus G9241. A/J and C57BL/6J mice were inoculated by the intranasal (A) or subcutaneous (B) route with B. cereus G9241 spores to determine the LD50 for each route. Each symbol (•) represents one A/J (orange) or one C57BL/6J (green) mouse. The median time to death at each dose is represented by the black horizontal line; a time to death of 14 days was assigned to all mice that survived the experiment. Significant differences in the median time to death were calculated with the Mann-Whitney rank sum test, and the P values are shown on the graph where applicable.

